A recent study showed that when training reasoning models, the best SFT checkpoint for downstream RL can occur well before the checkpoint with the strongest SFT performance, with validation loss emerging as a surprisingly effective predictor of post-RL performance. In this post, I reproduce this observation on a much smaller language model and examine how the model evolves around the optimal pre-RL checkpoint. Along the way, I explore several training dynamics that may help build intuition for why validation loss within a training run has the capacity to predict downstream RL performance. Github link coming soon.
1. Background
Supervised fine-tuning (SFT) followed by reinforcement learning (RL) with verifiable rewards has become a canonical recipe for training reasoning models1. During SFT, the model is trained on high-quality chain-of-thought2 (CoT) traces, often distilled from stronger models, to acquire plausible reasoning behaviors. This is followed by RL, typically using GRPO or its variants, which reinforces reasoning trajectories that lead to correct final answers. Together, these two stages progressively reshape the model’s response distribution.
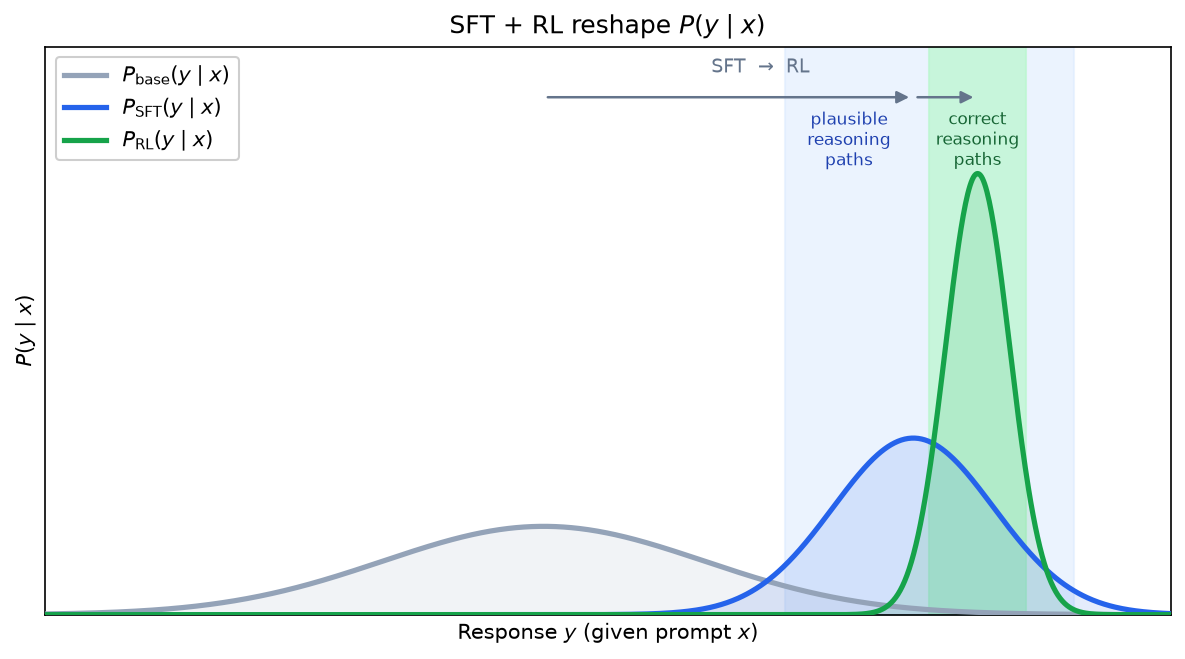
Figure 1: My understanding of the SFT→RL pipeline as progressively reshaping the model’s response distribution.
Viewed as part of the SFT→RL pipeline, the role of SFT is not to produce the strongest standalone model, but to provide the best initialization for downstream RL. This naturally raises the question of whether conventional SFT metrics, such as validation pass@1, are the right signals for selecting the checkpoint to hand over to RL.
Kang et al.3 recently investigated this question and found that the checkpoint leading to the best downstream RL performance can appear well before the checkpoint with the strongest standalone SFT performance. They also showed that validation loss on held-out reasoning examples closely tracks post-RL performance. In this post, I reproduce this gap on a smaller model, then examine what changes along the SFT trajectory might make validation loss a better pre-RL checkpoint-selection signal than pass@1. Throughout, validation loss refers to standard token-level validation cross-entropy (CE), the usual likelihood-based objective for autoregressive language models.
2. Experiment setup
I use allenai/OLMo-2-0425-1B4 as the base model and GSM8K5 as the training and evaluation dataset. For SFT, I generate think+answer chain-of-thought traces using DeepSeek-V4-Flash6, retaining only samples with correct final answers. Model checkpoints are saved periodically throughout SFT, from which I select five representative checkpoints for downstream RL evaluation. RL is performed using GSPO7 with 8 rollouts per group, two random seeds per checkpoint, and early stopping based on the validation reward.
3. The early peak of post-RL potential
As inexpensive proxy metrics, I compute the validation reward and validation loss for every SFT checkpoint. Figure 2 shows that the validation loss reaches its minimum substantially earlier than the validation reward reaches its maximum.
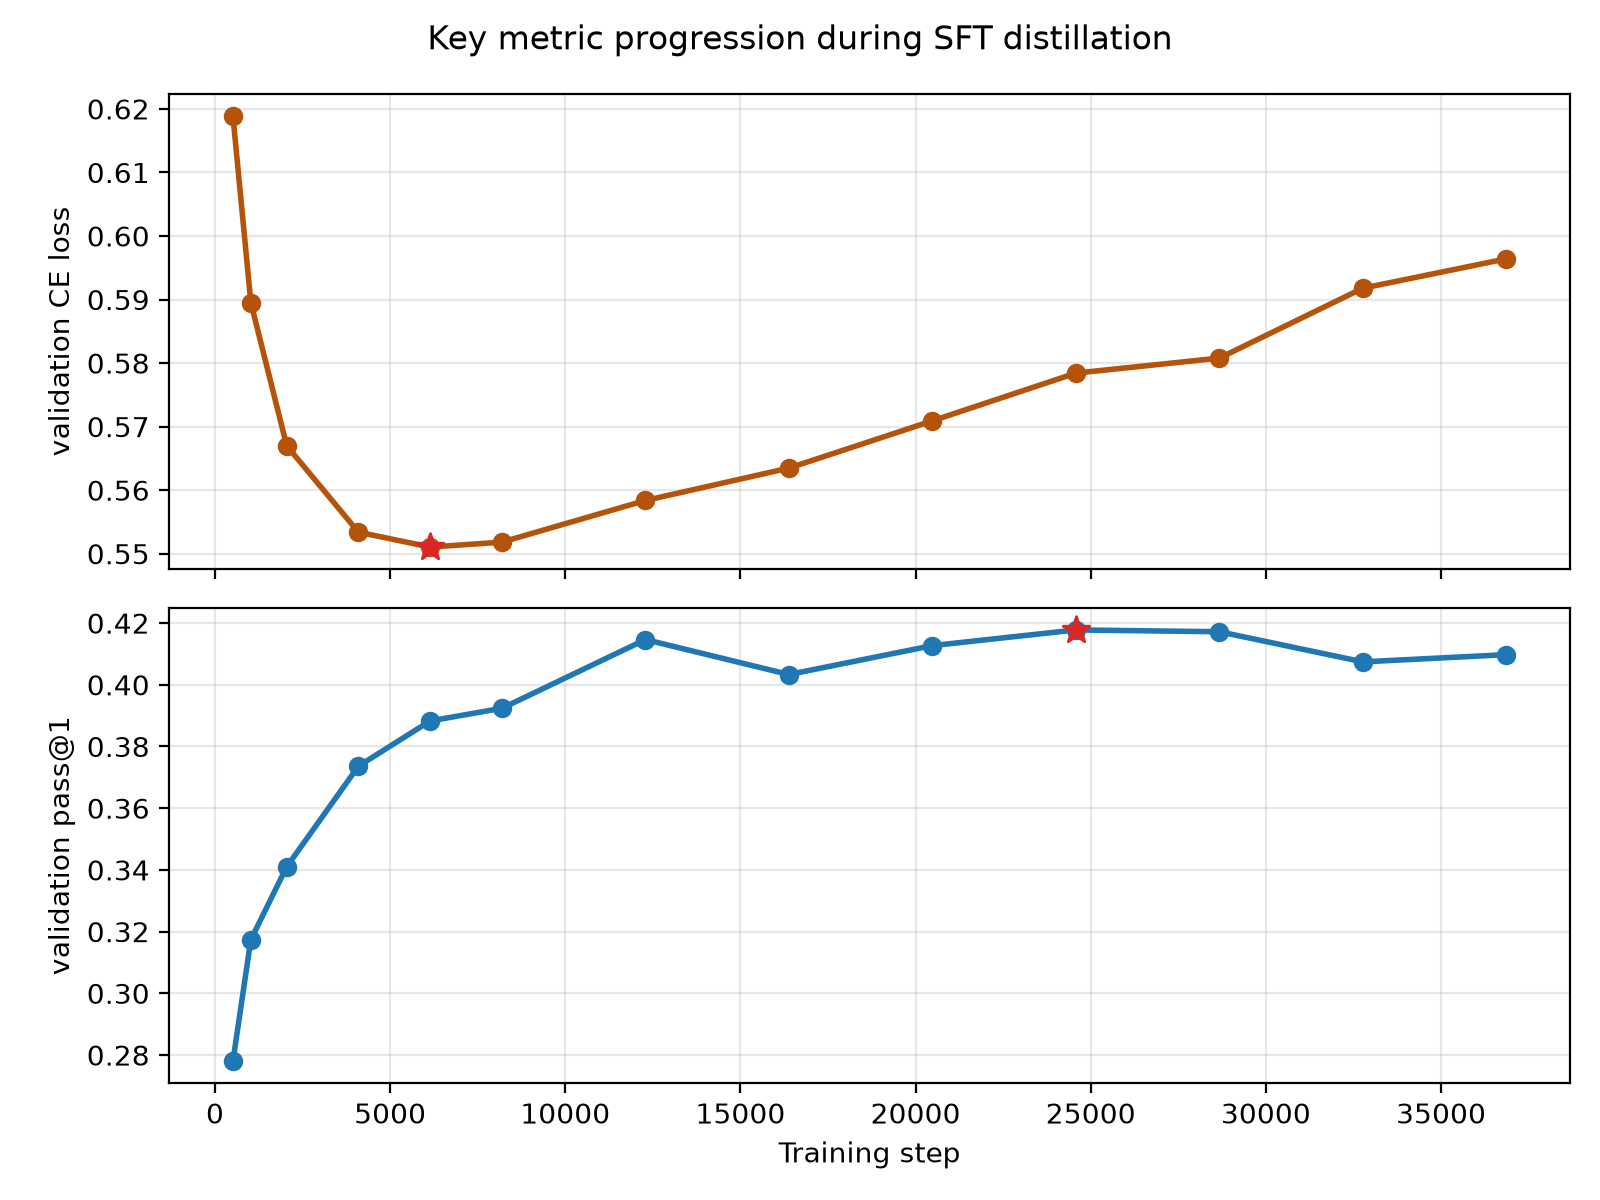
Figure 2: Validation cross-entropy loss and validation pass@1 throughout SFT.
I then perform RL on five representative SFT checkpoints. Following Kang et al. 3, I also evaluate pass@64 on these checkpoints. The resulting downstream RL performance is averaged over two RL runs per checkpoint.
| Step | validation pass@64 post-SFT | test pass@1 post-SFT | test pass@1 post-RL |
|---|---|---|---|
step-0512 |
0.8797 | 0.2665 | 0.5306 |
step-6144 |
0.9203 | 0.3767 | 0.5692 |
step-12288 |
0.9172 | 0.4068 | 0.5451 |
step-24576 |
0.9094 | 0.4030 | 0.5458 |
step-36864 |
0.9047 | 0.3974 | 0.5318 |
The best downstream RL performance occurs well before the strongest standalone SFT checkpoint. Moreover, the checkpoint producing the best RL performance also coincides with the lowest validation loss and the highest pass@64, reproducing the central empirical observation by Kang et al. despite using a much smaller model.
The intuition behind pass@k as a predictor of downstream RL performance is relatively straightforward. It measures whether successful reasoning trajectories are likely to appear within a finite sampling budget, giving RL something useful to reinforce. Larger values of k reward models that keep correct trajectories reachable under sampling, rather than only models whose most likely trajectory is correct. Following Kang et al.3, I report pass@64 here and revisit later how this intuition plays out over the course of SFT.
Validation loss is a less intuitive predictor. Unlike pass@k, it is computed from teacher-forced token likelihoods rather than sampled rollouts, making its connection to downstream RL less obvious. The rest of this post explores this question by examining how validation loss, rollout confidence, and pass@k evolve along a single SFT trajectory.
4. Characterizing the model dynamics
We first examine how the validation loss evolves throughout SFT. Since validation cross-entropy is the average negative log-likelihood assigned to held-out tokens, understanding the evolution of the underlying token probability distribution provides a useful lens for interpreting the validation loss. Figure 3 plots the distribution of teacher-forced conditional probabilities assigned to every token in the held-out validation set at three checkpoints: start of SFT, around the point of minimum validation loss, late stage of SFT. Figures 4a-4f show how the distribution changes throughout SFT. Figure 5 additonally shows the progression of argmax conditional probabilities.
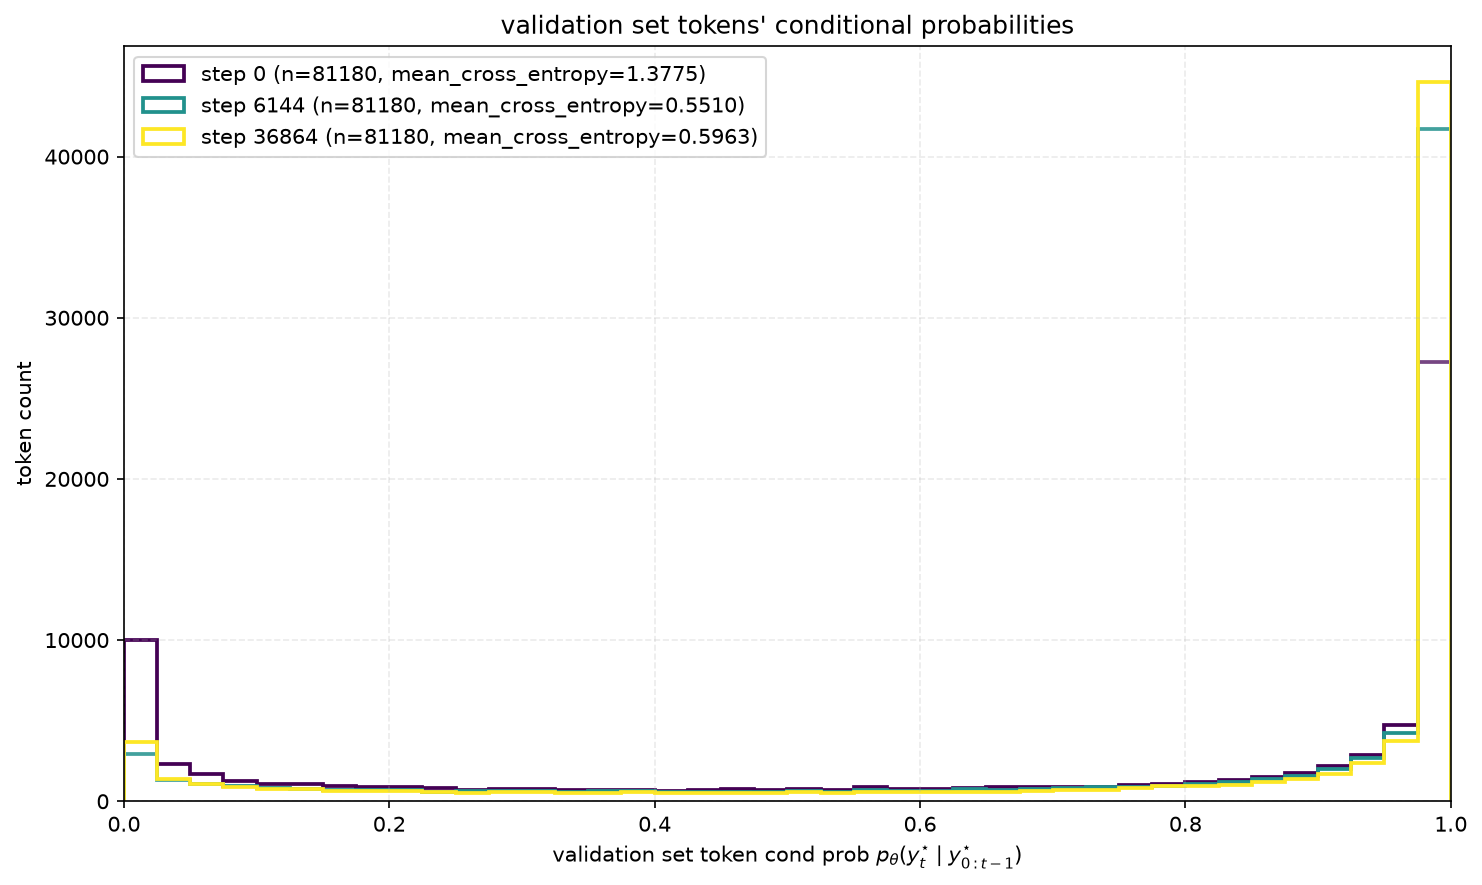
Figure 3: Distribution of teacher-forced conditional probabilities of all validation tokens. The validation cross-entropy is simply the expectation of the transformed distribution under $f(x)=-\log x$.
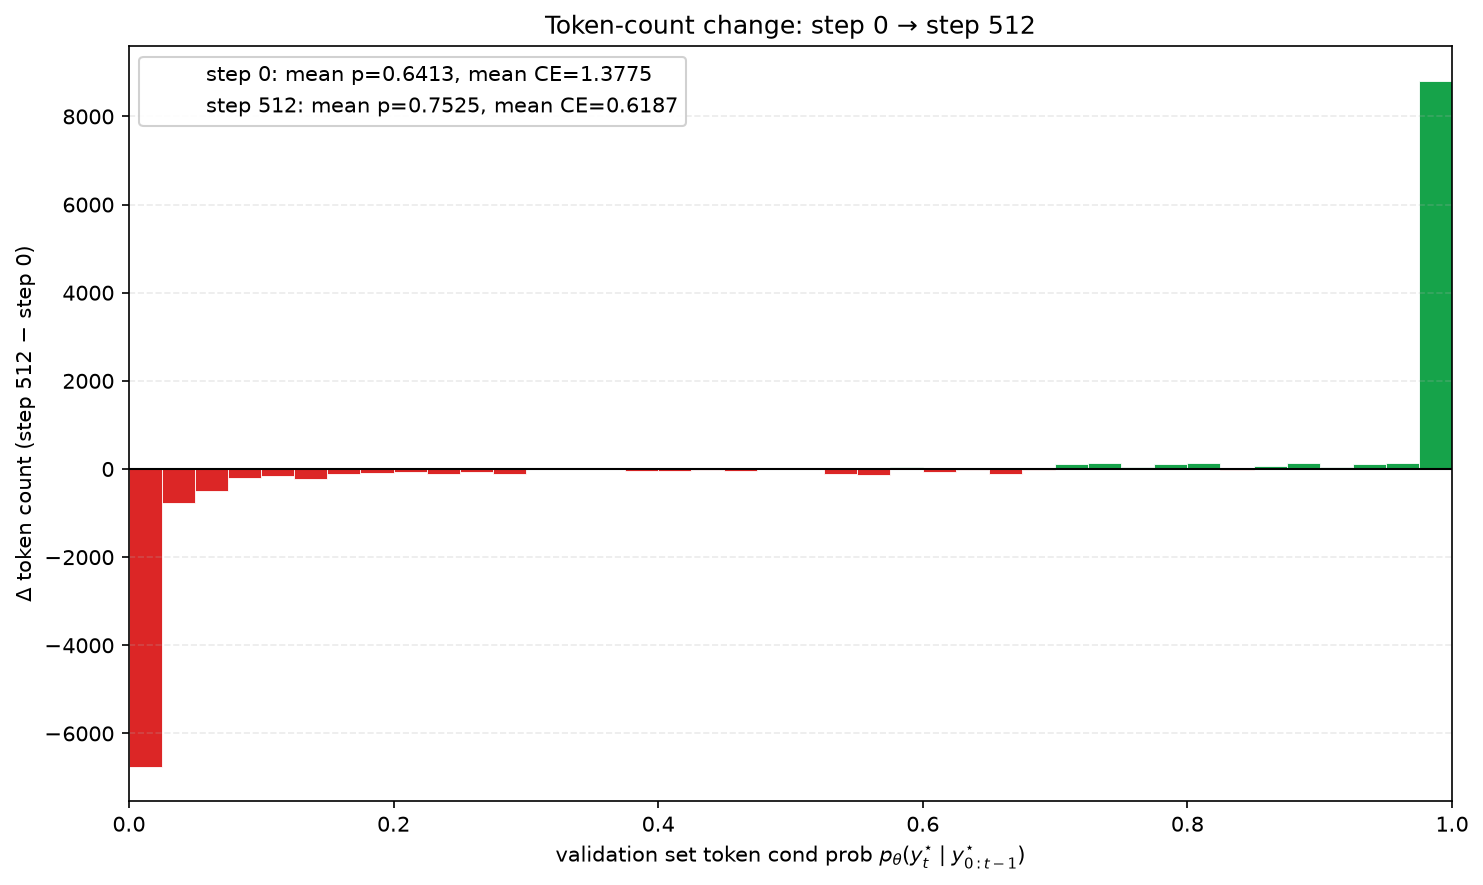
Figure 4a: Step 0 -> step 512 distribution delta.
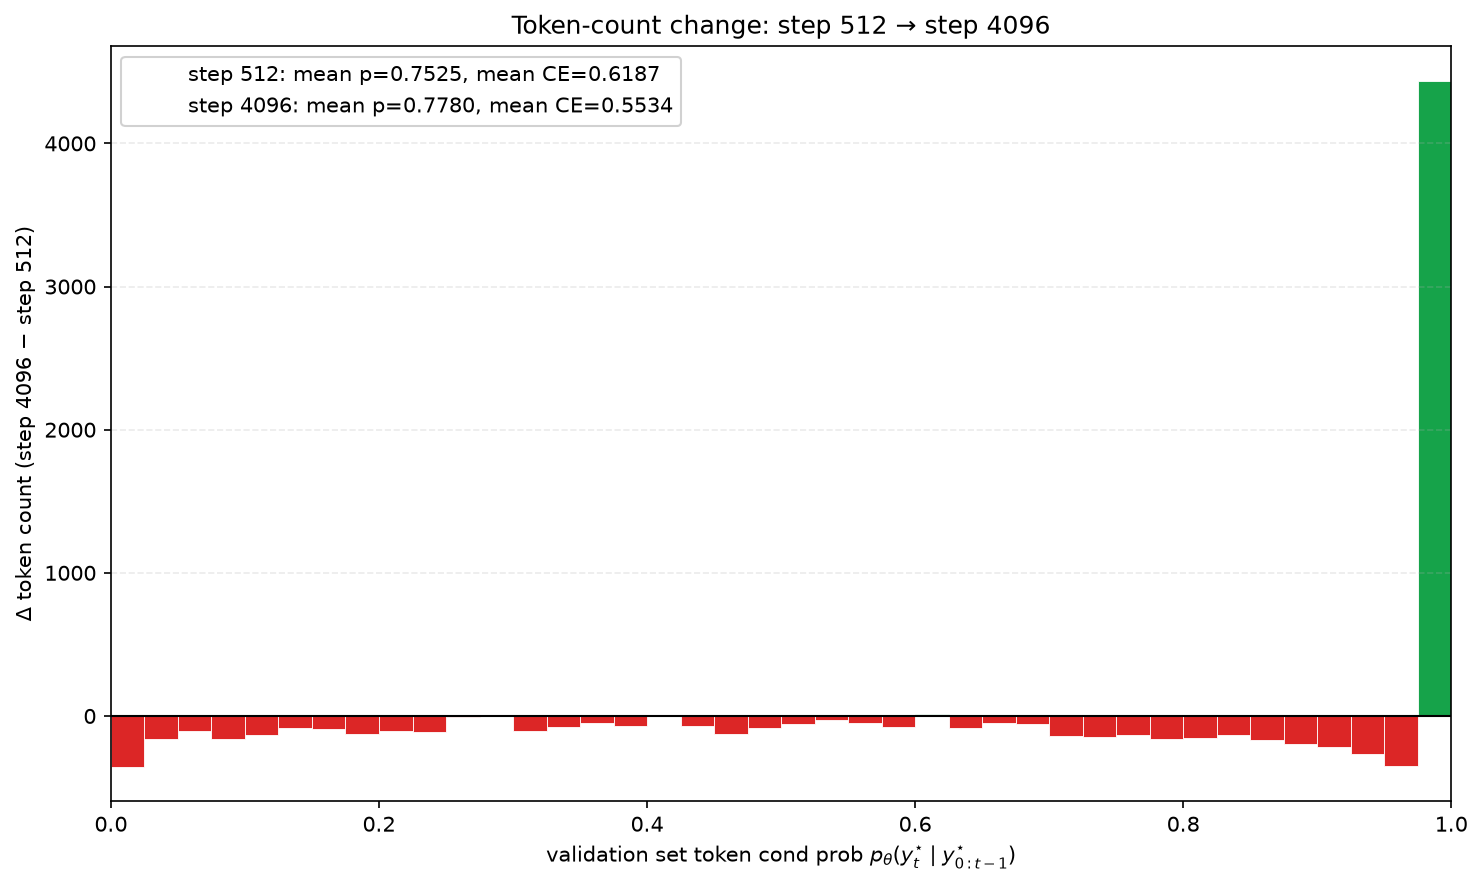
Figure 4b: Step 512 -> step 4096 distribution delta.
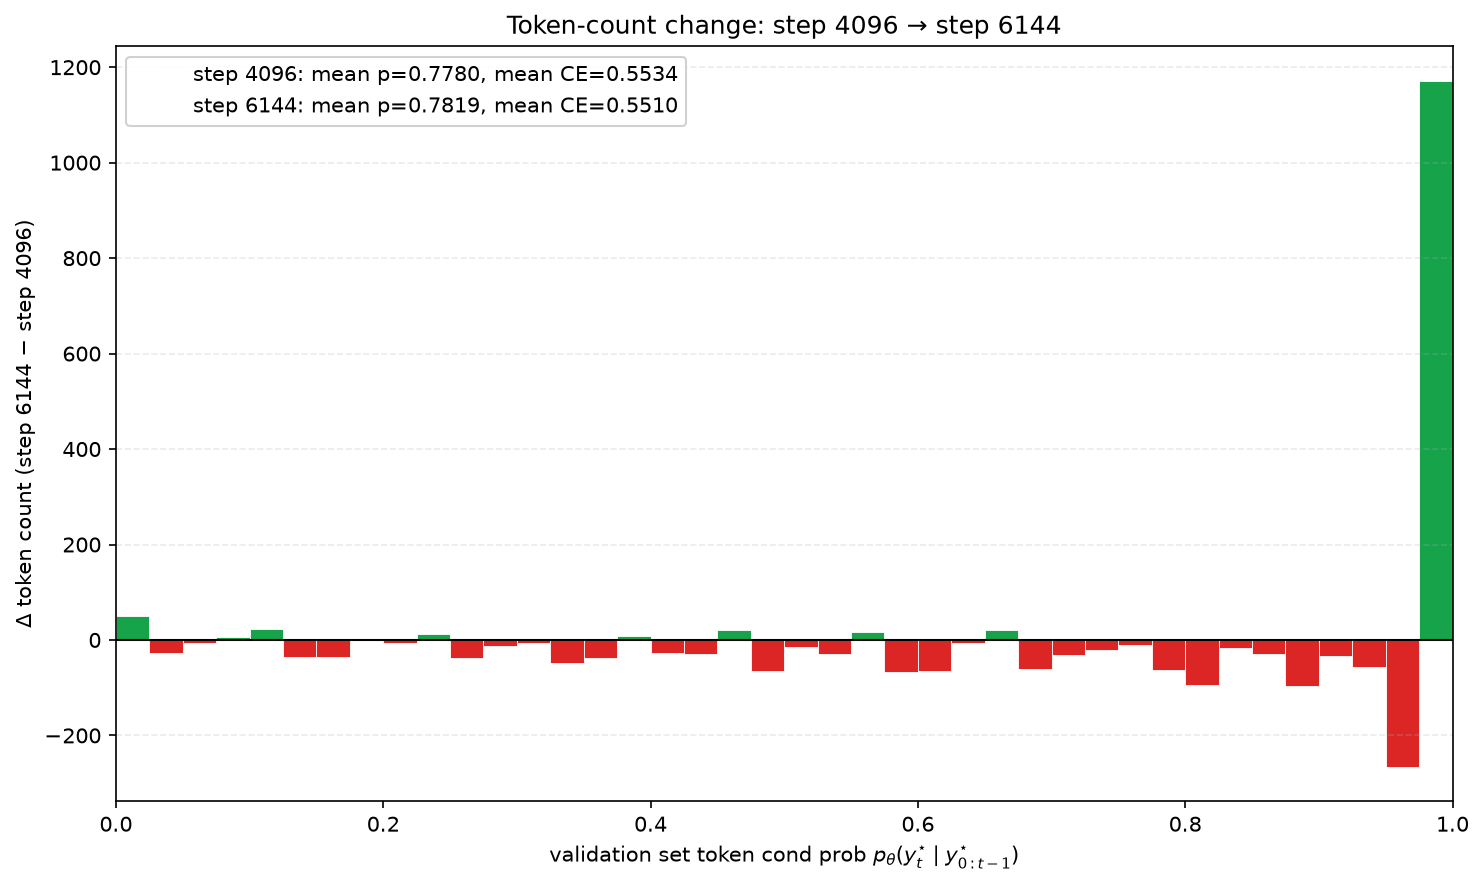
Figure 4c: Step 4096 -> step 6144 distribution delta.
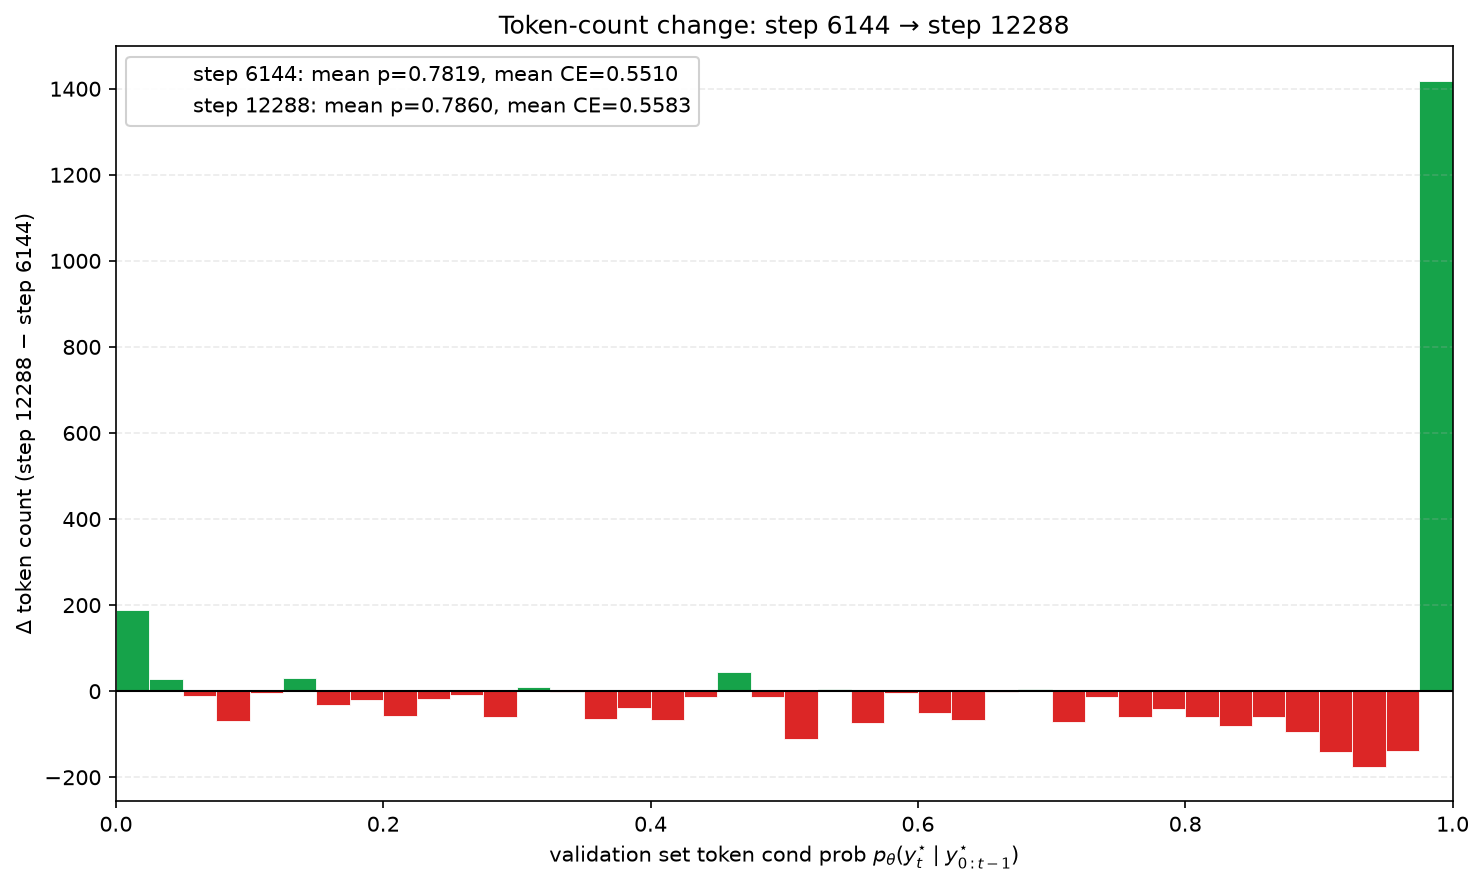
Figure 4d: Step 6144 -> step 12288 distribution delta.
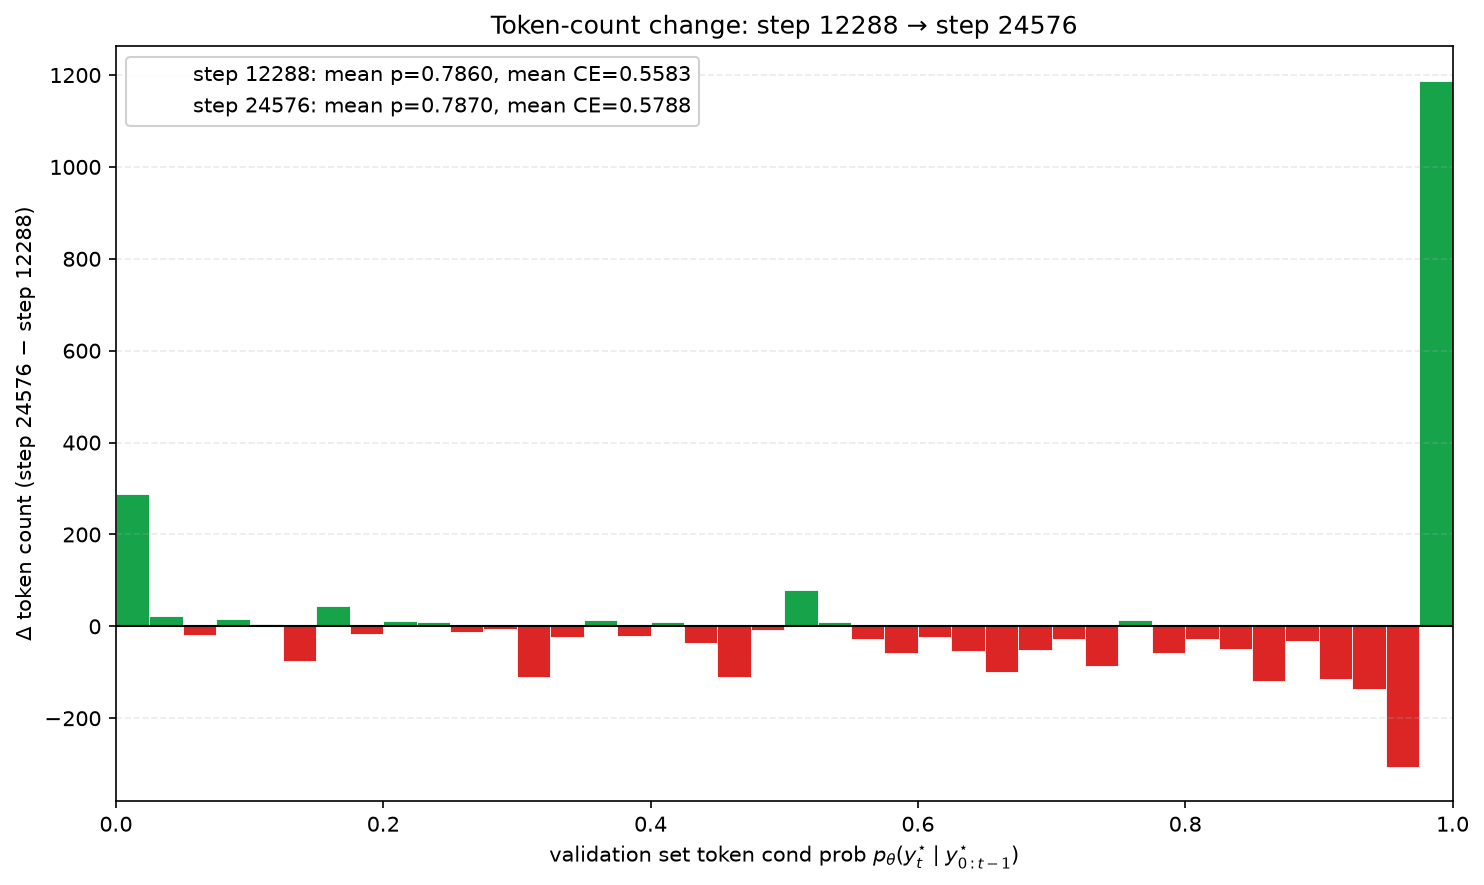
Figure 4e: Step 12288-> step 24576 distribution delta.
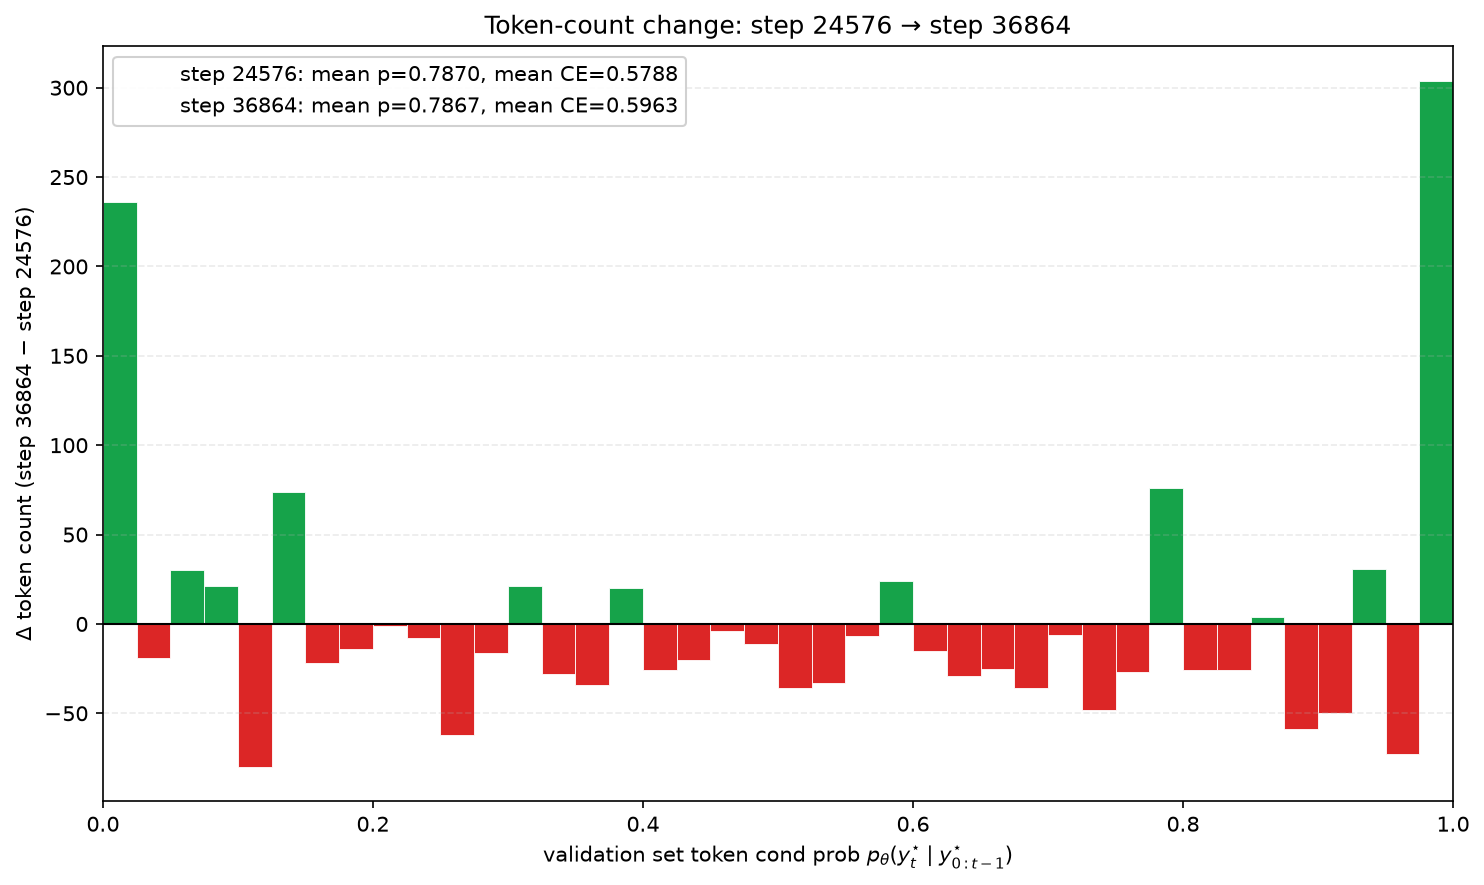
Figure 4f: Step 24576 -> step 36864 distribution delta.
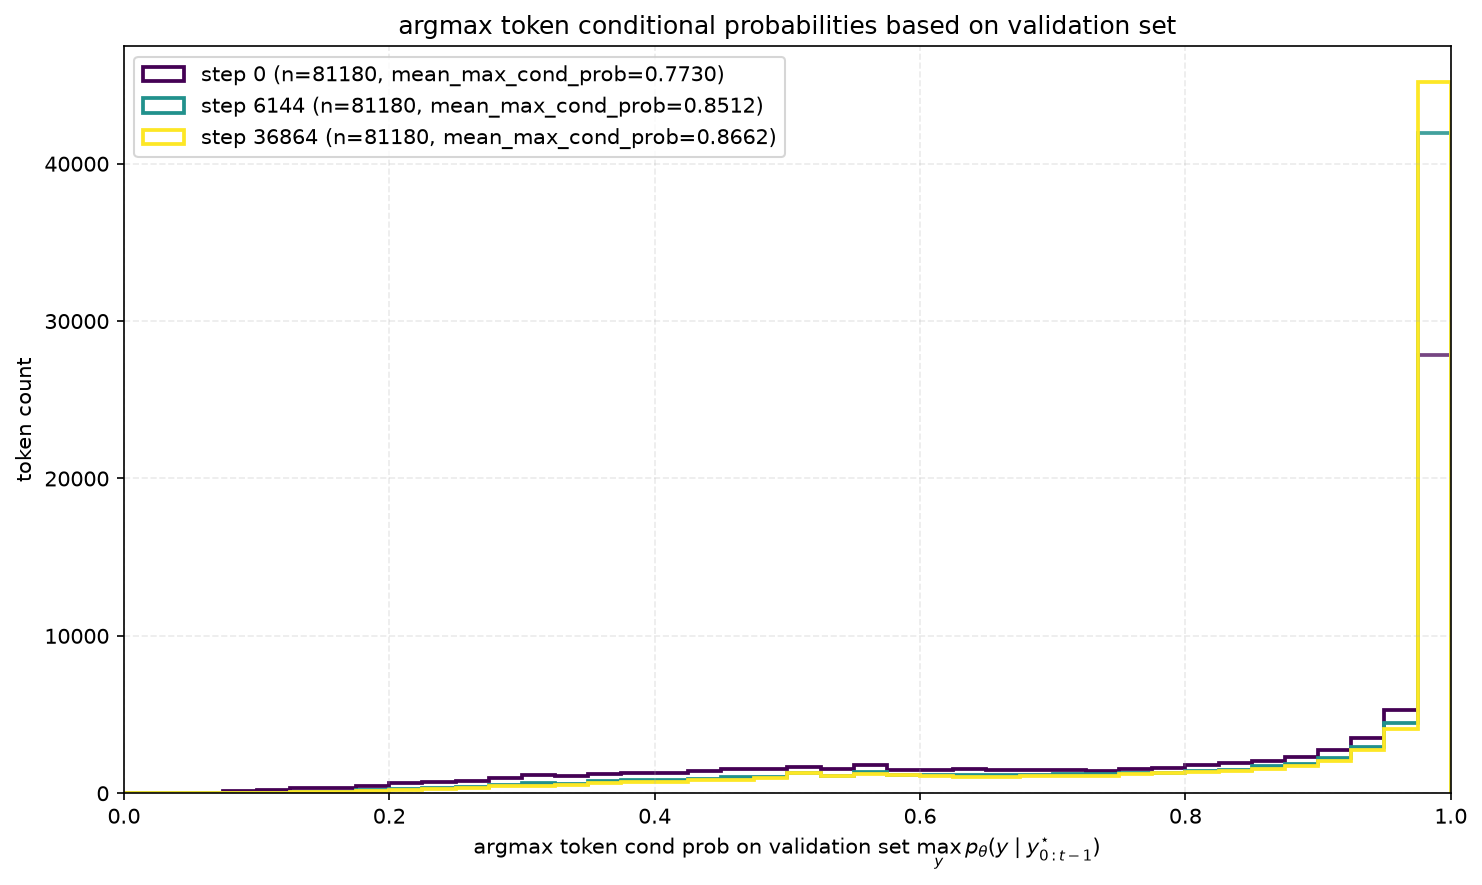
Figure 5: Distribution of argmax token conditional probabilities, teacher-forced on validation set subsequences. This reflects the progressive sharpness of the model’s predictive distribution.
Throughout SFT, the model’s teacher-forced probabilities assigned to validation tokens increasingly accumulate on either end. Early on, this mainly shows up as a growing right tail. Many held-out validation tokens receive higher probability, reflecting continued learning of useful reasoning patterns. As training continues, further sharpening around the training traces is consistent with more concentrated predictive distribution as shown in Figure 5. This can suppress alternative token patterns in the validation set, causing the left tail to grow. Since cross-entropy loss scales as $-\log p$, even a small number of newly low-probability validation tokens can outweigh heavier gain in the right tail, and start driving the loss up. Later in training, the rise becomes stronger as the left tail keeps growing and the right-tail growth slows down.
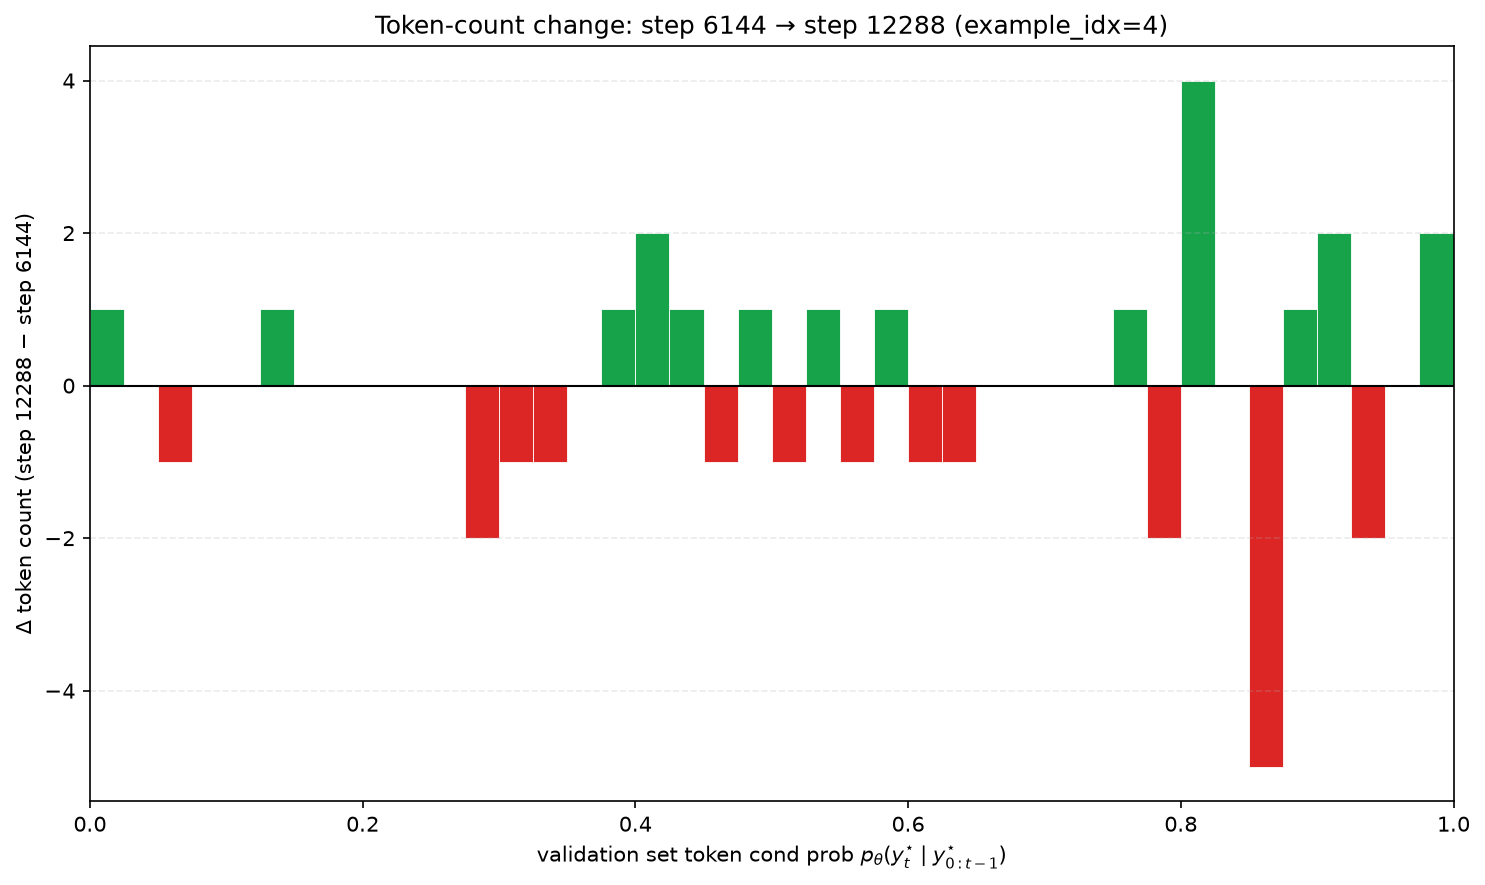
Figure 6: It is worth noting that at the level of individual prompts and reasoning traces, token probabilities evolve much more heterogeneously, with different tokens often changing in different directions. The aggregate distribution nevertheless exhibits a consistent progression towards polarized growth, with decreasing growth gap between right and left tail.
This is the familiar shape of overfitting under cross-entropy. The model keeps becoming more confident, but that confidence becomes increasingly uneven on held-out data. While cross-entropy benefits from improved likelihood of validation reasoning traces, because of $-\log p$ loss, it is also sensitive to, and adversely affected by the confidence sharpening process. As a side note, pass@1 appears slower to react. Based on the plots, it only starts to stagnate or drop when the net rightward probability mass shift is about to disappear.
Connection to RL
More importantly, this progressive concentration of the model’s predictive distribution manifests in its generated rollouts, which downstream RL ultimately learns from. Figure 7 shows that the model becomes progressively more confident in its generated reasoning throughout SFT.
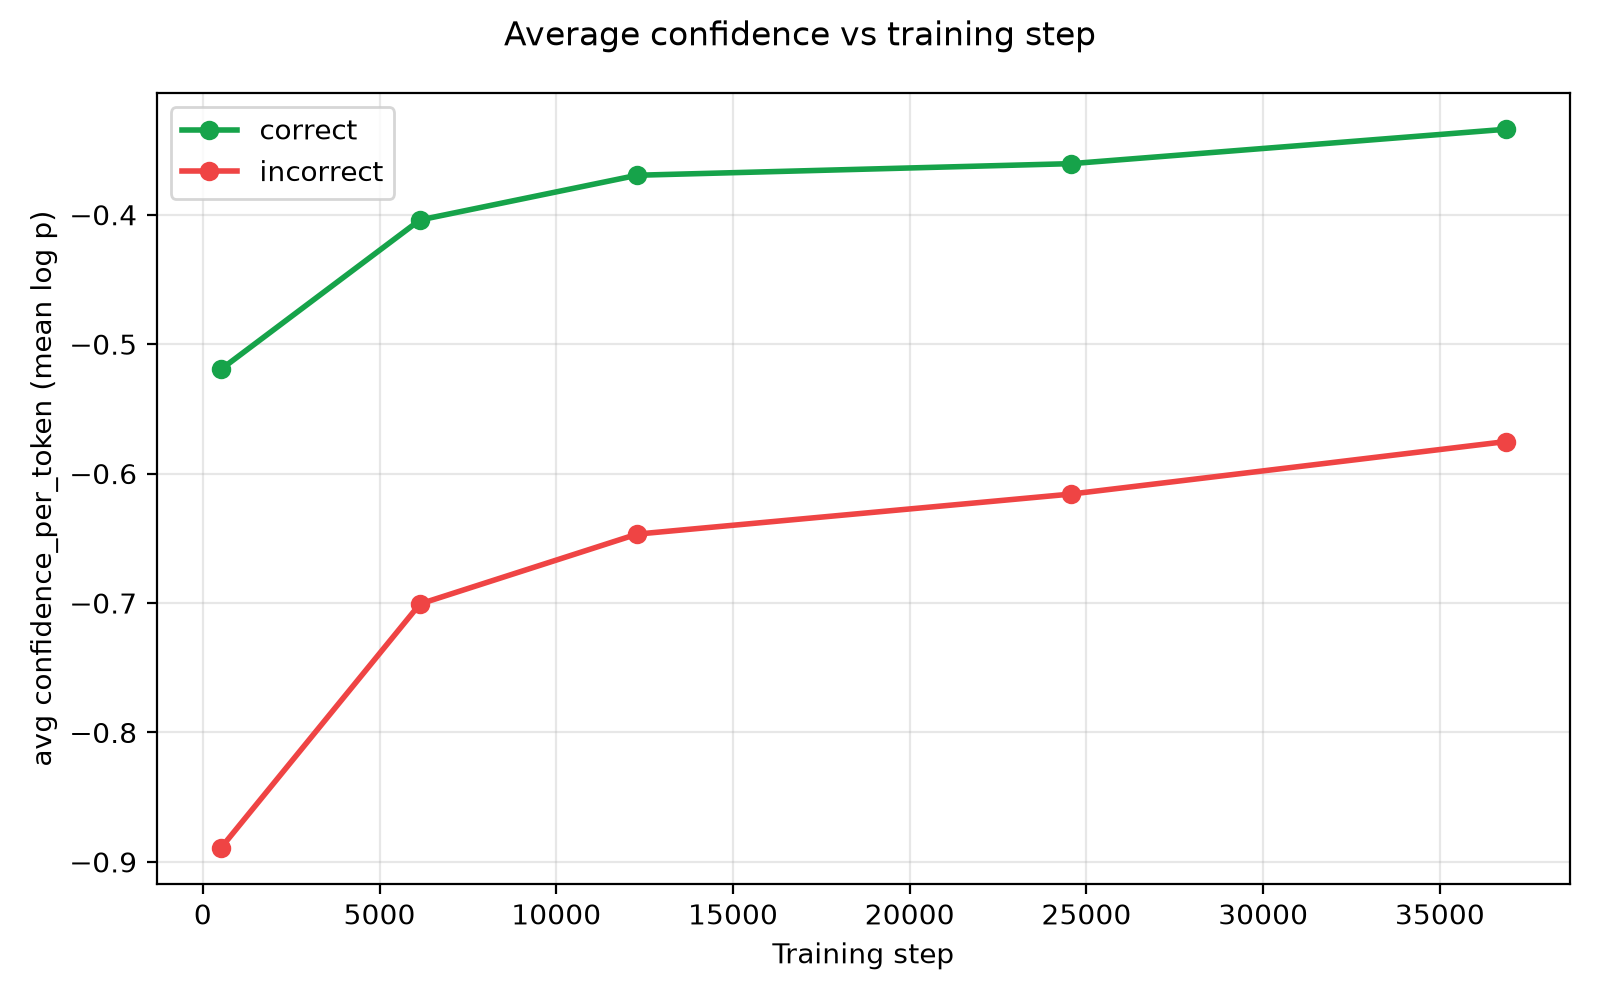
Figure 7: The model’s confidence in its rollouts grows throughout SFT for both correct and incorrect traces.
The two components captured by validation loss have opposing implications for downstream RL. Increasing probability assigned to correct reasoning trajectories should make useful behaviors easier to reinforce. Conversely, the progressive concentration of the rollout distribution may reduce the diversity of successful trajectories reachable during exploration. On prompts where the model is confidently wrong, the model may very rarely get to sample and reinforce a correct signal.
This interpretation should be read as suggestive rather than conclusive. The rollout-confidence analysis is a coarse proxy for the exploration problem: higher confidence on incorrect traces is not automatically harmful, since the decisive errors may occur at only a few branching points. In that case, I would need to establish confidence increases on those branching points. So alternative explanations remain possible until further analysis.
Still, this interpretation is consistent with the evolution of pass@k. In this run, the checkpoint maximizing pass@k shifts progressively earlier as k increases, consistent with larger-k evaluation benefiting from a less concentrated rollout distribution.
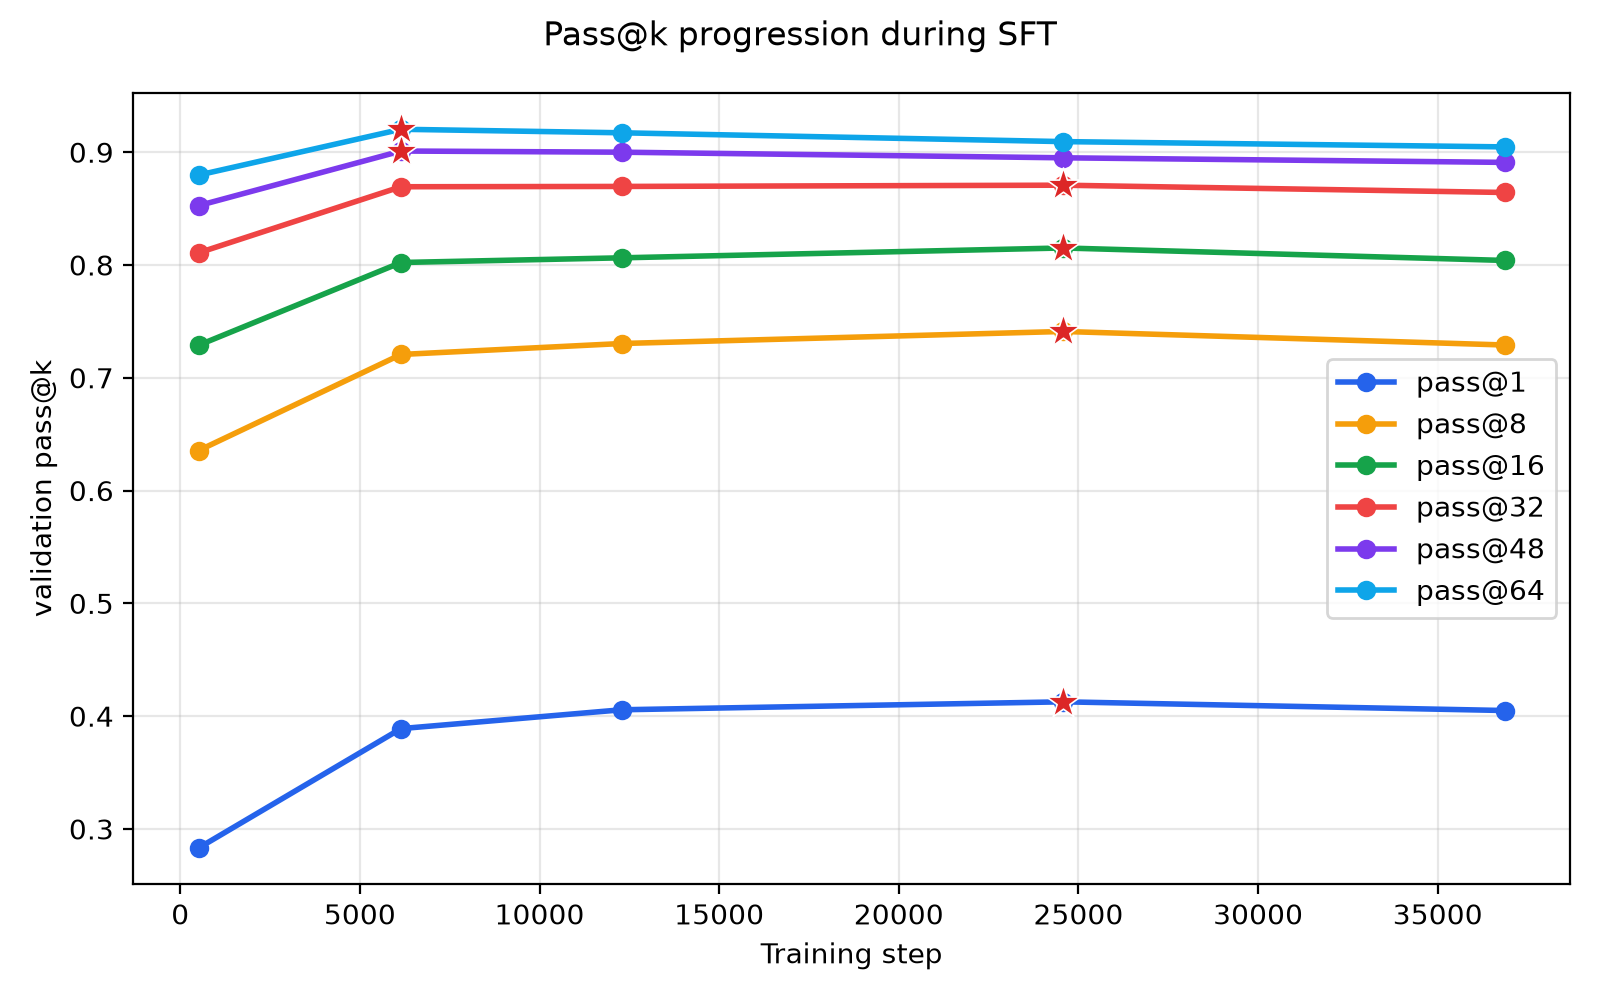
Figure 8: The optimal checkpoint for pass@k shifts earlier as k increases.
Taken together, these observations suggest that validation cross-entropy is useful because it tracks a tradeoff that also shapes the rollout distribution. As SFT sharpens the model, correct reasoning trajectories may become easier to sample and reinforce, but wrong trajectories can also become more confidently preferred, reducing exploration. Within this SFT run, validation loss appears to capture the onset of this tradeoff before it is clearly reflected in pass@1, offering one possible explanation for its stronger checkpoint-selection performance.
5. Conclusion
In this post, I reproduced the early pre-RL checkpoint phenomenon reported by Kang et al. on a much smaller reasoning model and examined the training dynamics around that checkpoint. The results suggest that validation cross-entropy loss appears to track a predictive distribution tradeoff that matters for downstream RL, offering an intuition why it can serve as a useful checkpoint selection signal within an SFT run. The results should be viewed as a suggestive lens rather than a conclusive mechanism. These analyses also do not fully explain why the minimum of validation loss occurs near the best pre-RL checkpoint. That alignment likely depends on the optimization dynamics of SFT itself, and remains an interesting direction for future work.
References
-
Shao, Z., Wang, P., Zhu, Q., Xu, R., Song, J., Bi, X., Zhang, H., Zhang, M., Li, Y. K., Wu, Y., & Guo, D. (2024). DeepSeekMath: Pushing the limits of mathematical reasoning in open language models. arXiv. https://arxiv.org/abs/2402.03300 ↩︎
-
Wei, J., Wang, X., Schuurmans, D., Bosma, M., Ichter, B., Xia, F., Chi, E., Le, Q., & Zhou, D. (2022). Chain-of-thought prompting elicits reasoning in large language models. arXiv. https://arxiv.org/abs/2201.11903 ↩︎
-
Kang, F., Kuchnik, M., Padthe, K., Vlastelica, M., Jia, R., Wu, C.-J., & Ardalani, N. (2025). Quagmires in SFT-RL post-training: When high SFT scores mislead and what to use instead. arXiv. https://arxiv.org/abs/2510.01624 ↩︎ ↩︎ ↩︎
-
OLMo Team et al. (2025). 2 OLMo 2 Furious. arXiv. https://arxiv.org/abs/2501.00656 ↩︎
-
Cobbe, K., Kosaraju, V., Bavarian, M., Chen, M., Jun, H., Kaiser, L., Plappert, M., Tworek, J., Hilton, J., Nakano, R., Hesse, C., & Schulman, J. (2021). Training verifiers to solve math word problems. arXiv. https://arxiv.org/abs/2110.14168 ↩︎
-
DeepSeek-AI. (2026). DeepSeek-V4: Towards highly efficient million-token context intelligence. arXiv. https://arxiv.org/abs/2606.19348 ↩︎
-
Zheng, C., Liu, S., Li, M., Chen, X.-H., Yu, B., Gao, C., Dang, K., Liu, Y., Men, R., Yang, A., Zhou, J., & Lin, J. (2025). Group sequence policy optimization. arXiv. https://arxiv.org/abs/2507.18071 ↩︎